S&P 500 Sector Breadth & Rotation
As of close 2026-10-15 · 503 constituents · generated 2026-10-16 08:28 PDT · equal-weight breadth by GICS sector · data.json
How this works (click to show / hide)
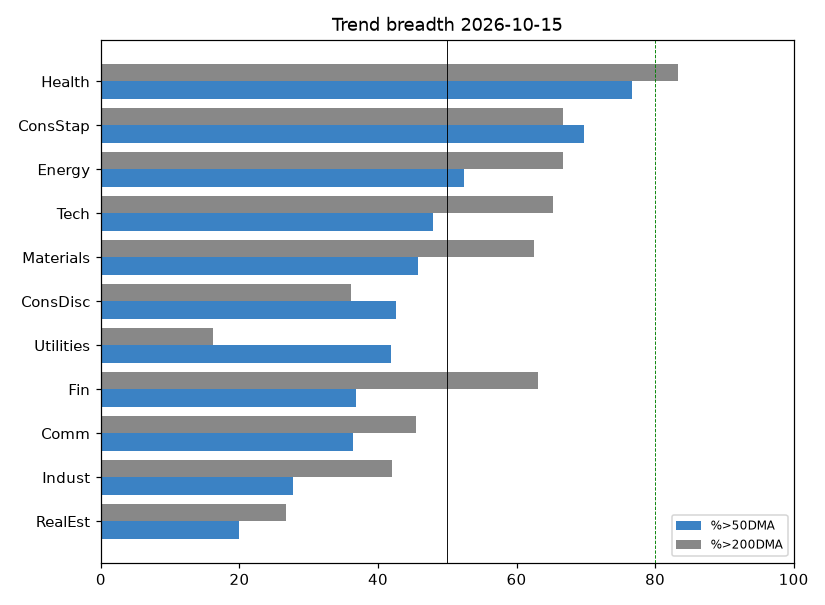
- Breadth = the % of a sector's stocks trading above their 20-, 50- and 200-day average price (short, medium, long trend). Every stock counts equally.
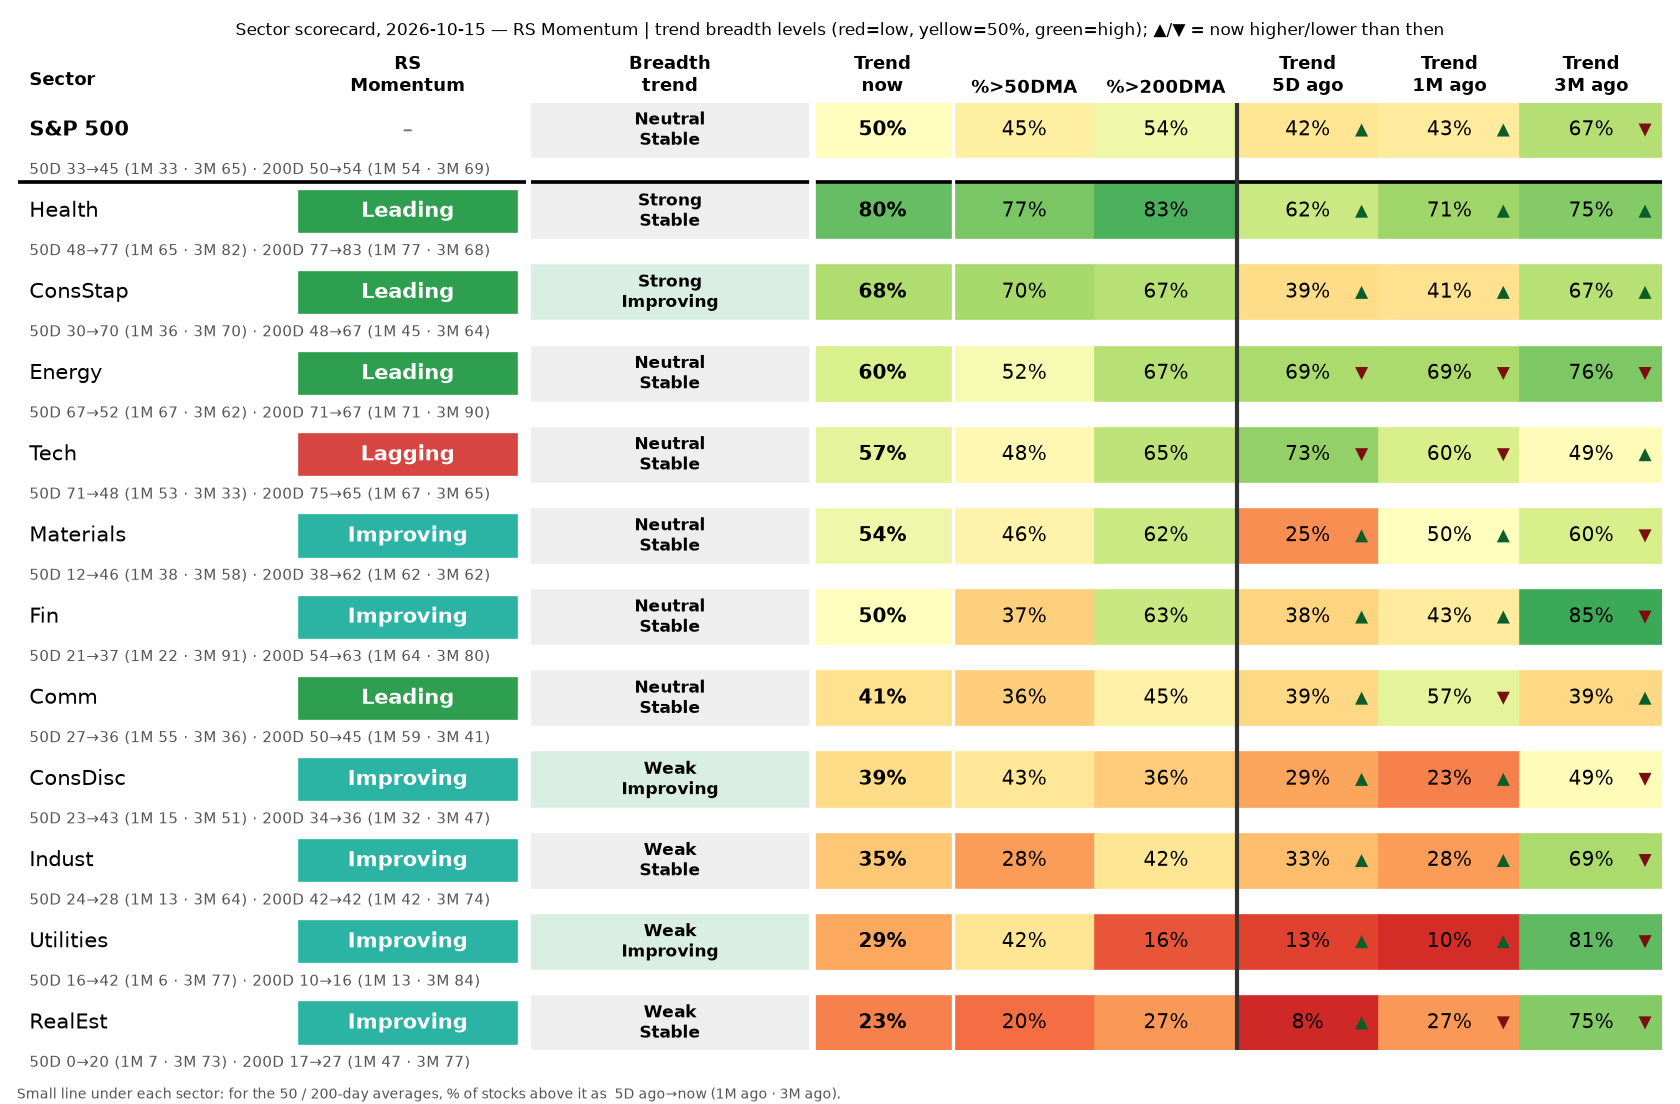
- Trend breadth = the simple average of those three percentages. Now / 5D / 1M / 3M ago are its levels today and 5, 21 and 63 trading days earlier; ▲/▼ shows whether it is now higher or lower.
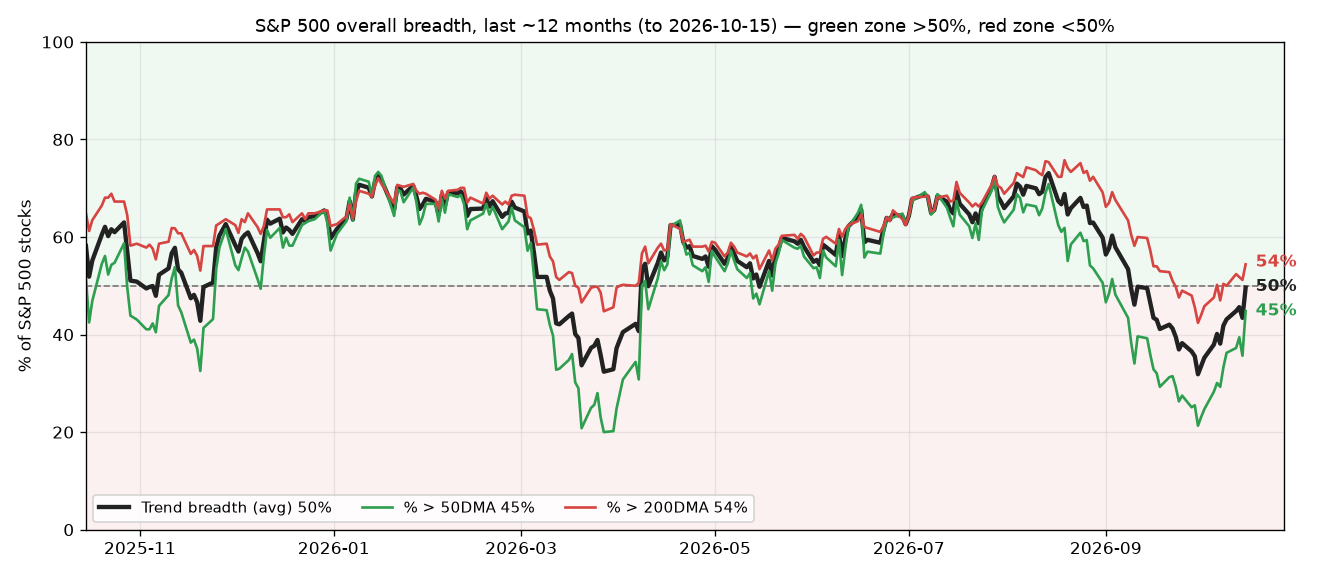
- S&P 500 row & history chart: the pinned top row pools all ~500 stocks together (it is not an average of the 11 sectors). The history chart shows its trend breadth (black) with %>20DMA (orange), %>50DMA (green) and %>200DMA (red) over ~12 months; above 50% (green zone) means most stocks are in an uptrend. "Sector participation" counts how many sectors are Improving / Deteriorating and how many have trend breadth above 50%.
- Level: Strong ≥ 60%, Neutral 40–60%, Weak < 40%.
- Direction (from the changes): Improving = up 10+ pts over 1M and not down over 5D. Deteriorating = down 10+ over 1M and not up over 5D. Reversing Up = down 10+ over 1M but up 10+ over 5D. Reversing Down = up 10+ over 1M but down 10+ over 5D. Otherwise Stable.
- Highs − lows (H-L) = % of stocks at a 20-day (or 52-week) closing high minus % at a low. Positive means more new highs than lows.
- Score (0–100) = 50% trend breadth + 25% highs−lows + 25% relative-strength momentum rank vs the other sectors. "Wk Δ" is the change vs 5 days ago.
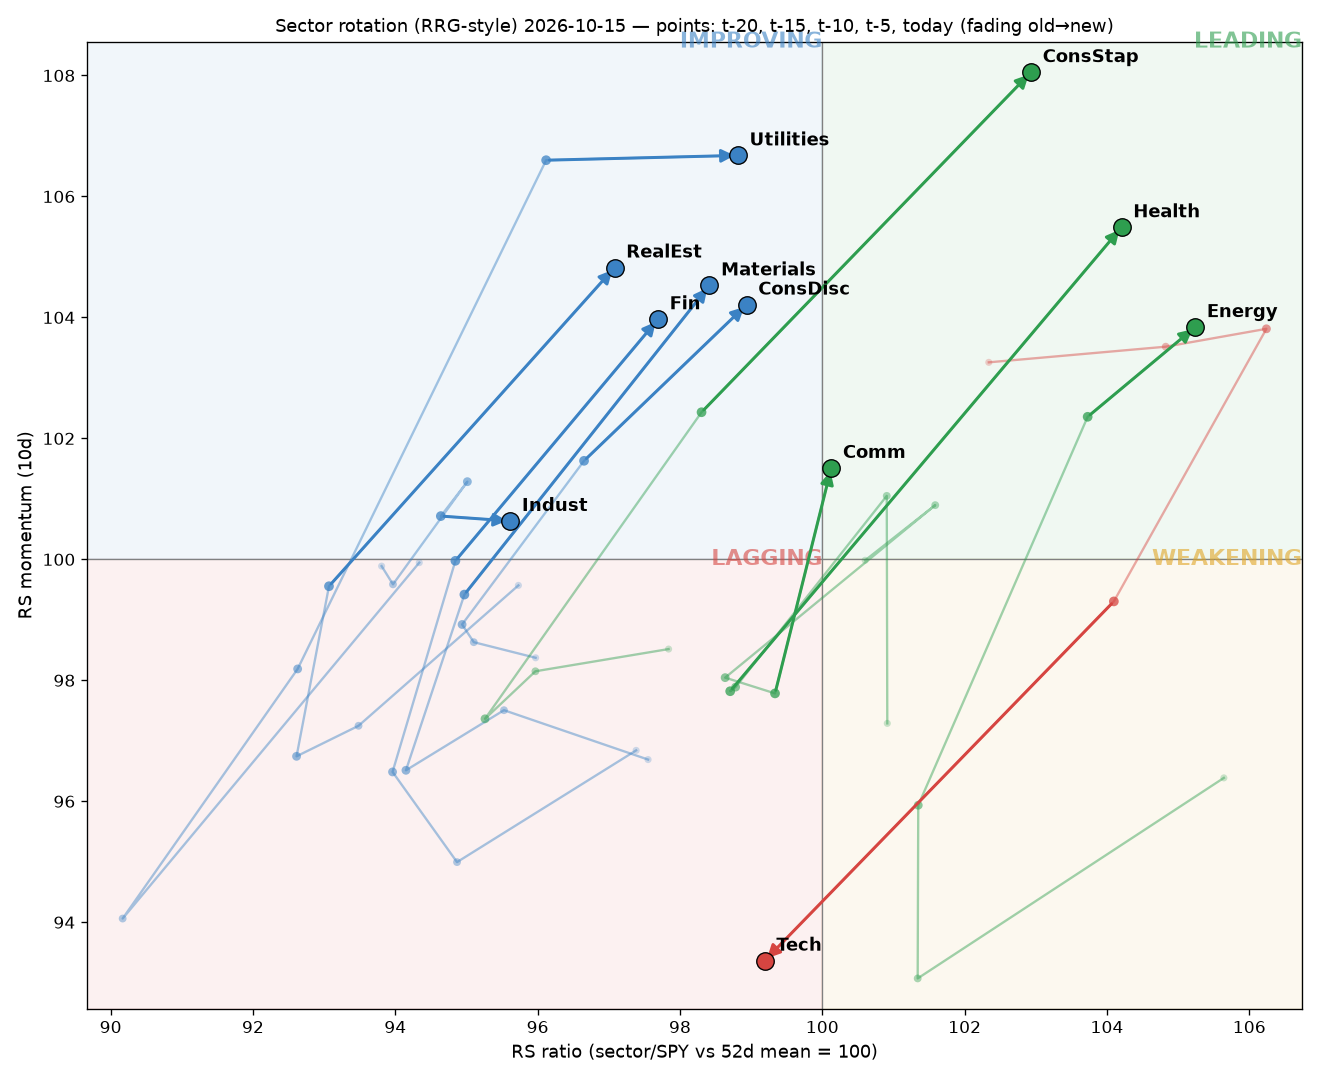
- Rotation chart: each sector's ETF strength vs SPY (x: above/below 100 = outperforming/underperforming its recent average) against how fast that is changing (y). Quadrants: Leading (strong & rising), Weakening (strong but fading), Lagging (weak & falling), Improving (weak but rising). Tails show weekly points over the last month (t-20, -15, -10, -5, today); the arrow marks today.
- Industry flags: a sub-industry with at least 4 stocks is flagged when its %>50DMA differs from its sector's by more than 25 points – an early sign of what is driving (or lagging) the sector.
- Data: daily closes from Yahoo Finance; the day's bar is used only after the close. Not investment advice.
Sector table (click headers to sort)
| Sector | N | Score | Wk Δ | Quadrant | Breadth trend | Trend | %>20 | %>50 | %>200 | 5D ago | 1M ago | 3M ago | H-L 20d | H-L 52w | RS rank (Δ1w/1m/3m) |
|---|---|---|---|---|---|---|---|---|---|---|---|---|---|---|---|
| S&P 500 | 503 | – | – | – | Neutral · Improving | 57% | 70% | 45% | 54% | 44% ▲ | 36% ▲ | 64% ▼ | +28 | +5 | – |
| Health | 60 | 86.0 | +39.3 | Leading | Strong · Improving | 84% | 93% | 77% | 83% | 57% ▲ | 59% ▲ | 75% ▲ | +60 | +27 | 2 (+2/+1/-0) |
| ConsStap | 34 | 83.8 | +22.7 | Leading | Strong · Improving | 77% | 94% | 70% | 67% | 46% ▲ | 33% ▲ | 66% ▲ | +55 | +9 | 3 (+2/+2/+2) |
| Materials | 24 | 65.7 | +32.7 | Improving | Strong · Improving | 61% | 75% | 46% | 62% | 25% ▲ | 40% ▲ | 54% ▲ | +50 | +4 | 8 (-0/-1/-0) |
| Utilities | 31 | 64.4 | +7.3 | Improving | Neutral · Improving | 53% | 100% | 42% | 16% | 38% ▲ | 8% ▲ | 66% ▼ | +23 | +0 | 7 (-0/+4/-0) |
| ConsDisc | 47 | 58.8 | +9.8 | Improving | Neutral · Improving | 53% | 81% | 43% | 36% | 36% ▲ | 18% ▲ | 47% ▲ | +45 | +4 | 6 (-0/+3/+3) |
| Fin | 76 | 55.5 | +9.9 | Improving | Neutral · Improving | 54% | 63% | 37% | 63% | 37% ▲ | 34% ▲ | 85% ▼ | +33 | +3 | 9 (-0/-3/-8) |
| Energy | 21 | 53.5 | -20.1 | Leading | Strong · Stable | 65% | 76% | 52% | 67% | 73% ▼ | 57% ▲ | 76% ▼ | -5 | +0 | 1 (+1/-0/+3) |
| RealEst | 30 | 51.7 | +24.7 | Improving | Weak · Improving | 38% | 67% | 20% | 27% | 8% ▲ | 20% ▲ | 76% ▼ | +17 | +0 | 10 (+1/-2/-7) |
| Comm | 22 | 45.8 | +10.6 | Leading | Neutral · Stable | 48% | 64% | 36% | 45% | 41% ▲ | 52% ▼ | 42% ▲ | +18 | +0 | 4 (-1/-2/+6) |
| Indust | 83 | 41.9 | -4.5 | Improving | Neutral · Improving | 45% | 64% | 28% | 42% | 36% ▲ | 20% ▲ | 61% ▼ | +19 | +1 | 11 (-1/-1/-5) |
| Tech | 75 | 39.2 | -15.0 | Lagging | Neutral · Stable | 50% | 37% | 48% | 65% | 70% ▼ | 52% ▼ | 47% ▲ | -5 | +0 | 5 (-4/-1/+6) |
Score = 50% trend breadth (avg %>20/50/200DMA) + 25% highs−lows (20d/52w) + 25% RS-momentum percentile. 5D/1M/3M ago = trend breadth level 5, 21 and 63 trading days earlier; ▲/▼ shows whether it is now higher/lower.
S&P 500 overall (all 503 stocks pooled, not an average of sectors): positive 1M return 61% · daily A/D net +51% · H-L 20d +28, 52w +5
Sector participation: 8 Improving · 0 Deteriorating · 0 Reversing Up · 0 Reversing Down · 3 Stable · 8/11 sectors with trend breadth > 50% · 3/11 with %>50DMA > 50%
Overall S&P 500 breadth history (~12 months)
Flags
- Comm: quadrant Lagging -> Leading (vs prior day)
- ConsStap: quadrant Improving -> Leading (vs 1wk ago)
- Fin: quadrant Lagging -> Improving (vs 1wk ago)
- Health: quadrant Lagging -> Leading (vs 1wk ago)
- Tech: quadrant Weakening -> Lagging (vs prior day)
- Materials: quadrant Lagging -> Improving (vs 1wk ago)
- RealEst: quadrant Lagging -> Improving (vs 1wk ago)
- Utilities: %>50DMA crossed below 50% (55 -> 42)
Rotation (RRG-style) with weekly tails
Trend breadth & change heatmap
%>50DMA / %>200DMA
Industry divergences (>25pt gap in %>50DMA vs sector, ≥4 members)
| Sub-industry | Sector | N | %>50DMA | Sector %>50DMA | Gap (pts) |
|---|---|---|---|---|---|
| Interactive Media & Services | Comm | 4 | 100% | 36% | +64 |
| Financial Exchanges & Data | Fin | 9 | 89% | 37% | +52 |
| IT Consulting & Other Services | Tech | 4 | 100% | 48% | +52 |
| Semiconductor Materials & Equipment | Tech | 5 | 0% | 48% | -48 |
| Environmental & Facilities Services | Indust | 4 | 75% | 28% | +47 |
| Homebuilding | ConsDisc | 4 | 0% | 43% | -43 |
| Regional Banks | Fin | 6 | 0% | 37% | -37 |
| Investment Banking & Brokerage | Fin | 6 | 0% | 37% | -37 |
| Diversified Banks | Fin | 7 | 0% | 37% | -37 |
| Packaged Foods & Meats | ConsStap | 8 | 38% | 70% | -32 |
| Communications Equipment | Tech | 6 | 17% | 48% | -31 |
| Application Software | Tech | 14 | 79% | 48% | +31 |
| Transaction & Payment Processing Services | Fin | 9 | 67% | 37% | +30 |
| Building Products | Indust | 7 | 57% | 28% | +29 |
| Asset Management & Custody Banks | Fin | 12 | 8% | 37% | -28 |
| Construction & Engineering | Indust | 4 | 0% | 28% | -28 |
| Construction Machinery & Heavy Transportation Equipment | Indust | 4 | 0% | 28% | -28 |
| Oil & Gas Storage & Transportation | Energy | 4 | 25% | 52% | -27 |
| Paper & Plastic Packaging Products & Materials | Materials | 5 | 20% | 46% | -26 |
Data notes
- dropped intraday bar 2026-10-16 (market not closed/settled)
Source: Yahoo Finance daily closes (free, may have gaps/revisions); constituents/GICS from Wikipedia. Same-day bars before the close are dropped. Not investment advice.